Article
BeginnerFour Tutorials, One Idea
Four tutorials, one idea: name the things in your member data and the connections between them, and it becomes a map you can walk.
Knowledge Graph Ontology Getting Started Association staff
Your association holds more data than it can use, and the reason is not a lack of software. Researchers who study how nonprofits manage information have a name for the pattern: Voida, Harmon, and Al-Ani called it the “homebrew database,” the patchwork of spreadsheets, personal trackers, and half-adopted platforms that nonprofit staff assemble to get their jobs done. Their finding was not that the patchwork exists. It was what the patchwork costs: version-control problems, redundant data entry, and data that ends up siloed or simply unreachable. Voida, Harmon, and Al-Ani’s study of nonprofit information management
A follow-up study reported the same pattern even in leading-edge organizations. In one case study of a business-intelligence rollout, much of the data sat in systems with no import mechanism, some lived in spreadsheets that staff updated by hand every day, and some was never digitized at all. The authors’ conclusion was blunt: analyzing the organization’s own data had become nearly intractable. They also named the trap that keeps the pattern in place: data collection driven by outside demands, carried out at the expense of the mission, produces erosion of autonomy, data drift, and data fragmentation, three consequences that reinforce each other until the organization has less control over its own data. Bopp, Harmon, and Voida’s study of nonprofits and data-driven work
Here is what that cycle looks like from the membership desk on a Tuesday. A board member asks which members attended both annual meetings but never joined a committee. Attendance lives in the events platform. Committee rosters live in the AMS. The overlap of the two lives nowhere, because no system was built to hold it. Each system answers the question it was built for. The question that needs two systems gets a “let me get back to you,” followed by an afternoon of exported spreadsheets. This is a teaching example, not a case study.
From the sponsor’s chair, the same failure reads differently. A sponsor asks how many of your members attended their session and then renewed, and the honest answer takes a week. The association that answers in a day looks competent. The one that answers in a week looks disorganized. The data to answer in a day already exists. It just has no map.
The four graph tutorials on this site are one answer to that Tuesday, seen four ways. The answer is not a bigger system. It is a habit: name the things in your data, name the connections between them, and the collection becomes a map you can move through. A map gives every connection a name, including the ones no single system was built to show. What was unnamed is now findable, and what is findable can be acted on.
The fuller version of this argument, including why AI models reason better over a graph than over flat text, is Association Ontology.
Here is the part most teams miss, and the reason the four tutorials belong together. The four views are not four tools. They are four questions you can ask about the same data, and each question assumes the names the previous one established. The first view asks what you hold. The second asks how the facts connect. The third asks who moves whom. The fourth asks all of it in plain words. Worked in order, they produce one connected map. Treated as separate tips, they produce four more spreadsheets.
A walk is the payoff. Start at one member and follow the “attended” connection to an event, then “serves on” to a committee, then “introduced” to the member who brought them in. Three hops, three systems, one answer, no exports. Nobody needed a new platform for that. Somebody just needed to write down, once, that these connections exist, which is exactly the work the four views organize. The first view collects the names. The second states the facts. The third draws the people map. The fourth lets you ask the whole thing a question in your own words.
Naming sounds abstract until you do it once. It means deciding that “attended,” “serves on,” and “introduced” are three distinct connections rather than one vague column, and writing that decision down where the map can see it. The discipline is small and entirely human: someone who knows the members says what each relationship actually is, and the map records it. No model can do this part for you, because the knowledge lives in staff heads, not in the export. This is also why the map compounds. Every connection you name makes the next question cheaper, because the next question starts from names instead of from raw exports. And unlike the homebrew database, the map gets better the more people use it. Every staffer who asks a new question leaves the map one connection richer, because the question itself reveals which names are missing.
We think most associations already hold the answers their boards keep asking for. The data is there. What is missing is the map on top of it, and building the map is cheaper than buying another system, because naming is work a staff member can do, not work a vendor must sell.
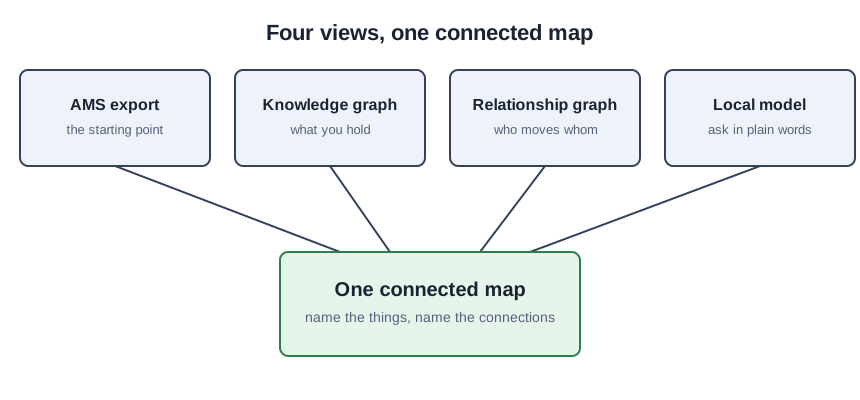
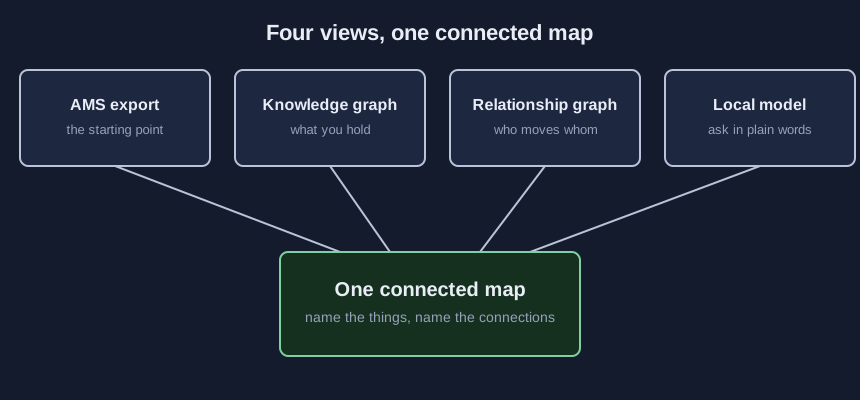
Which tutorial fits your situation
- If your starting point is an AMS export you have never really examined, start with Turn Your AMS Export Into an Ontology. It turns one CSV into named entity types, attributes, and relationships in about fifteen minutes, entirely in your browser.
- If the question is what you hold, start with Build Your First Association Knowledge Graph. It teaches you to name the things and the facts about them, beginning from a spreadsheet you already have.
- If the question is who moves whom, start with Map How Influence Flows With a Relationship Graph. It names the connections between people and traces the path influence travels, which the org chart never shows.
- If the question is one you want to ask in plain words, and you have no paid AI plan, start with Ask Your Graph Questions With a Local AI Model. The model runs on your own machine from a free one-time download, and the lab requires it to display the route it took to every answer, so you can verify each one against the real connections.
All four run in the browser. Three need nothing downloaded. The local-model lab needs a desktop or laptop with roughly a gigabyte and a half of free disk space for the single download of the model. Every lab opens on invented data, so you can try the whole idea before a single real member record goes in. After the download, every question and every answer stays on your own computer, which is the point for any staffer who has been told never to paste member data into a chatbot.
Two honest limits before the moves. A map does not clean dirty data. If the AMS holds three spellings of one company, the map holds three spellings of one company, and the naming step is where you finally see the mess. That is a feature, not a flaw: you cannot fix what you cannot see, and the homebrew database hides it by design. The second limit is the small model. It will be wrong sometimes, which is why the display-the-route discipline matters more than any single answer. A map you can check beats a confident answer you cannot.
Three moves for an ordinary month
First, export the smallest honest CSV your AMS will give you: one member per row, column names across the top. Open the mapper tutorial and run the invented sample before you touch your own data, so you see a finished map before you begin. The pass takes about fifteen minutes, your data never leaves the browser tab, and you watch your own data name itself.
Second, pick one question your desk currently answers badly, the two-system kind, and carry it through all four views in order. Ask what you hold, then how the facts connect, then who moves whom, then ask the model in plain words and check the route it displays against the real connections. One question through four views teaches more than four tutorials read in a row, because the views stop being separate pages and start being one map.
Third, change the default answer. The next time a two-system question lands on the desk, do not open a spreadsheet first. Ask whether the connection it needs already has a name in your map. If it does, the answer is a walk, not a project. If it does not, name it, and the map is one connection richer. That is the habit, and it compounds the way the homebrew database never did.
The homebrew database is not going away, and it does not need to. The systems do what they were built to do. What changes is what sits on top of them: one connected map that a staff member with no technical background can read, walk, and question. Four tutorials, one idea: the idea is the map.