Tutorial
BeginnerBuild Your First Association Knowledge Graph
Turn a spreadsheet into a knowledge graph: name the things, name the connections, and build a working graph in your browser from your own CSV.
Time needed: About 25 minutes
Before you start:
- A spreadsheet of member or program data exported as CSV (or use our sample)
- A modern browser; nothing to install
Knowledge Graph Ontology Csv Association staff
By the end of this tutorial you will have turned a membership spreadsheet into a knowledge graph you can click through: the named things in your data, the facts about them, and the named connections between them, built in your browser from your own CSV.
A knowledge graph is a small idea with a serious payoff. The W3C’s RDF 1.1 Concepts describes graph data as subject-predicate-object triples: a thing, a named connection, and another thing. Your spreadsheet already holds the things; this tutorial teaches you to name the connections, which is what makes the data answerable. This is a teaching example, not a case study: the Riverbend Trade Association and everyone in it are invented.
A spreadsheet answers one kind of question well: what is in this row. It answers another kind badly: how are these rows connected. Which members of the North Chapter hold a certification. That question spans four columns and no filter gets you there in one move. A knowledge graph stores the same cells as connections, so the question becomes a walk across the edges.
Try it now: the knowledge graph builder runs this whole tutorial in your browser. It loads the sample CSV for you; map the columns, tick the relationships, and watch the graph build itself. The starter kit (the sample CSV plus a one-page mapping worksheet) is free with your email.
Walk the finished graph right here first. This is the complete Riverbend knowledge graph: 18 named things, 20 named connections. Click any dot to walk its connections as buttons; drag the dots to rearrange. The steps below teach you to build a smaller version of this from a spreadsheet.
Click any dot to walk the graph. Every connection becomes a button.
-
Open the sample export and read the headers. The demo loads it automatically. Six fictional members, nine columns: first_name, last_name, email, company, title, chapter, member_since, committee, certification. Ask what each cell points to. An email cell points to a fact about a person. A company cell points to an organization that exists whether or not the person works there.
-
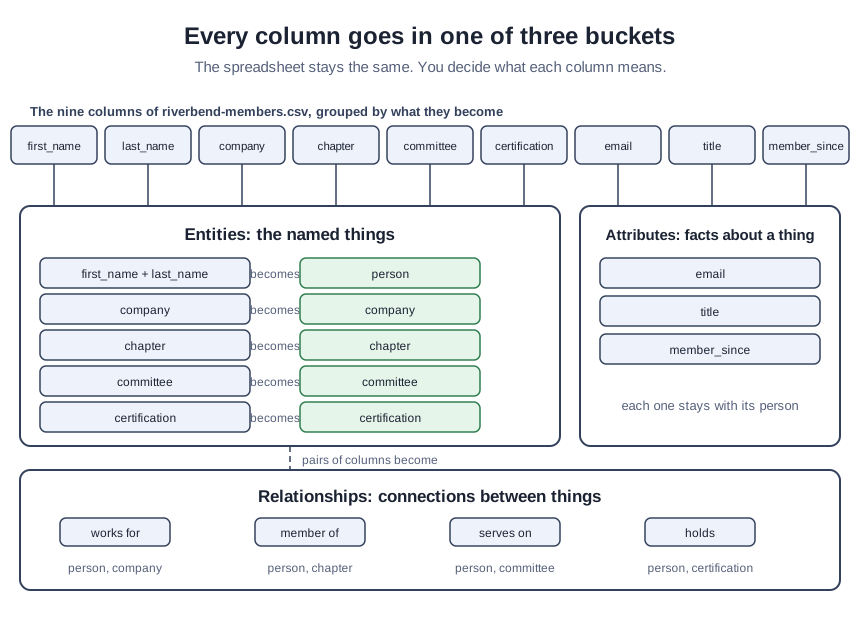
Sort every column into three buckets. A column becomes an entity (a named thing), an attribute (a fact about a thing), or half of a relationship (a connection between two things). In the sample, first_name and last_name together name a person; company, chapter, committee, and certification each name a thing of their own; email, title, and member_since are facts that stay with their person. If a column fits no bucket, it does not belong in the graph.
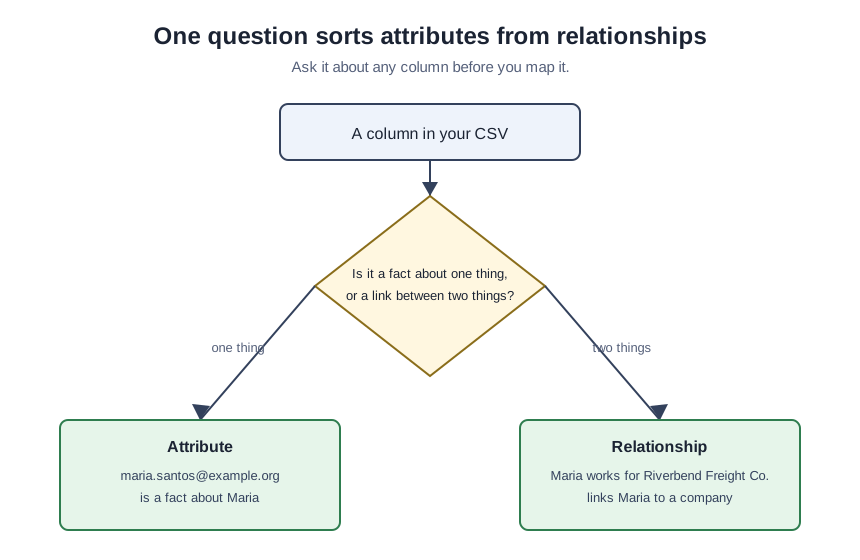
- Run the one-question test on anything ambiguous. “Is it a fact about one thing, or a link between two things?” [email protected] is a fact about Maria, so email stays an attribute. Maria works for Riverbend Freight Co. links Maria to a company, so “works for” becomes a relationship. If a column answers both ways at once, you are looking at two columns hiding in one cell; split it before you map it.
-
Combine first_name and last_name into one person. A person node needs a single name, so the demo joins the two columns with a space: “Maria” plus “Santos” becomes “Maria Santos”. Two columns, one entity.
-
Name every relationship with a verb phrase. “Works for”, “member of”, “serves on”, “holds”. Never “related to”, never the bare column header. The relationship name is the part of the graph you will read back later, so write it the way you would say it: “James Park works for Riverbend Freight Co.” If you cannot say the sentence out loud, the name is wrong.
-
Map the columns in the demo and press Build graph. The demo guesses each column’s type from its header; check the guesses, tick the four presets, and build. From the six sample rows you should get sixteen nodes and sixteen edges: six people, four companies, three chapters, two committees, one certification. Everything runs in your browser, so pasting a real export is safe: no upload happens, no server ever sees it.
-
Walk the graph and ask one real question. Click James Park and walk the “member of” button to North Chapter, then walk each member and check for a “holds” edge to a certification. Priya Nair holds Certified Logistics Professional, and she is the only one of the three who does. You just answered “which North Chapter members hold a certification” without a filter, a pivot table, or a query language.
Check your result: 16 nodes and 16 edges from the sample
Rebuild from the sample CSV and confirm the counts: sixteen nodes, sixteen edges. Click any person and confirm the walk panel lists every connection as a labeled button. Then press Load sample for the finished Riverbend graph: 18 nodes and 20 edges, with the association itself as its own node.
Three mapping mistakes that flatten your graph
Making every column an entity is the first mistake: email becomes a node, member_since becomes a node, and the graph fills with facts pretending to be things. The one-question test from step 3 exists to stop exactly this. Naming a relationship “related to” is the second: a graph you cannot read back is a spreadsheet with extra steps, so every edge gets a verb phrase. Forgetting the association itself as a node is the third: the member list never names the organization holding the list, so the graph ends up as members floating in nowhere. Add the association and the graph can say who leads it and what it hosts.
Take the starter kit
The kit holds the sample CSV and a one-page mapping worksheet with the entity types, the test, and blank lines for your columns. It is free with your email on the demo page.
Where this goes next
One spreadsheet made one graph you can walk. The Association Ontology book takes the same ideas further: knowledge graphs and relationship graphs used together, across member data, program data, and the records your association already keeps. The Association Ontology article lays out the concept; the book is the deep version.