Tutorial
IntermediateMap How Influence Flows With a Relationship Graph
Go beyond the org chart: map who knows whom, who trusts whom, and trace the real paths influence travels through your association.
Time needed: About 30 minutes
Before you start:
- Tutorial 1 (Build your first association knowledge graph), or a basic graph of your own
- A list of people and how they know each other
Relationship Graph Ontology Influence Association staff
By the end of this tutorial you will have a relationship map of your own association: named people, named connections, and one influence path your org chart hides. You need about thirty minutes, the people involved in one real decision, and a basic map of your association’s pieces (the companion tutorial, Build your first association knowledge graph, covers that starting point).
Try it now: open the relationship graph builder in your browser before you read the steps. It loads a sample map, lets you add your own people and connections, and traces one influence path stop by stop. The starter kit, a sample CSV plus a list of named relationship types, is free with your email.
A knowledge graph records what things are. A relationship graph records how things connect. The first says James Park is a person and the Safety Committee is a committee; the second says Tom Becker co-chairs with James Park and the Safety Committee advocates for the Highway Funding Bill. Think of the knowledge graph as the territory and the relationship graph as the roads, where the work gets done: introductions, mentorship, and trust.
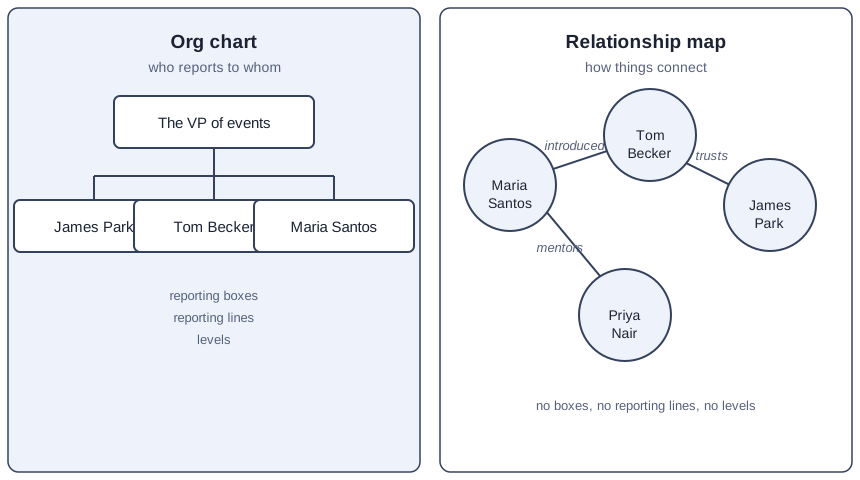
An org chart answers one question well: who reports to whom. It cannot show who listens to whom, who introduces whom, or who trusts whom. This tutorial builds that second map and reads it for the paths the hierarchy hides.
The worked example below uses a fictional Riverbend Trade Association. This is a teaching example, not a case study: every person and company in it is invented.
Stage 1: name the people and connections
-
Pick one decision and name the people around it. A relationship graph maps one decision at a time, not your whole membership. Choose a decision you actually need to move: a bill you want passed, a program you want funded, a vote you want won. Use real names, not roles. “The VP of events” is a slot on the chart; “Priya Nair” is a person someone can be introduced to. In the worked example, the decision is the fictional Highway Funding Bill, and the people include James Park, Tom Becker, Maria Santos, Alicia Tran, Robert Dale, and Priya Nair. Aim for eight to twelve names: fewer than six tells you nothing new, more than twenty means drawing lines instead of reading them.
-
Give every connection a name. For each pair, write the connection as one verb phrase. “Knows” is too vague to act on; “mentors,” “introduced,” “trusts,” “advocates for,” and “serves on” each say something different about what can travel along that line. One edge, one label, true enough to say out loud in a meeting. The W3C’s RDF Schema 1.1 gives every property a human-readable name and an optional description, because a name nobody defined is a name nobody can share. The starter kit includes twelve to build from.
Stage 2: draw the map and trace the path
- Draw the map without the hierarchy. Open the builder and add your people as rows: person A, the relationship, person B. Press Build graph. Notice what is missing: no boxes, no reporting lines, no levels. The Safety Committee sits next to the people who connect to it, not above them.
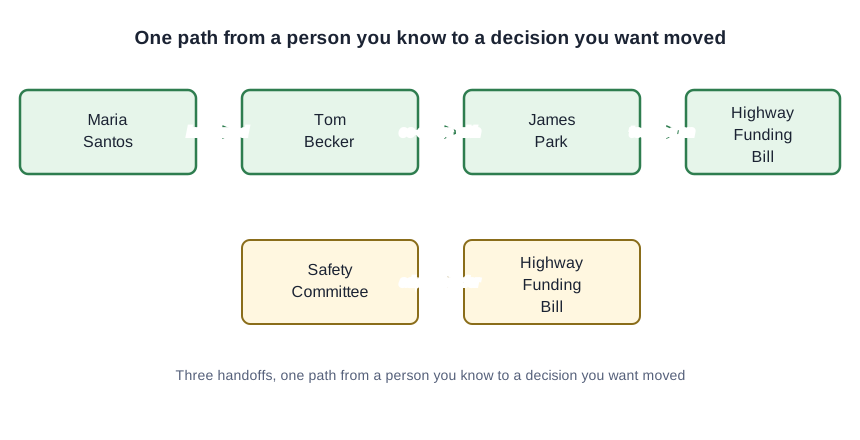
- Trace one influence path from a person to the decision. Pick the decision node and walk backward, one edge at a time: who can reach this person? In the Riverbend sample the chain runs like this. Maria Santos introduced Tom Becker. Tom Becker co-chairs with James Park. James Park testified on the Highway Funding Bill. Three handoffs, one path from a person you know to a decision you want moved. The builder’s guided walk traces the four stops in order. The Safety Committee advocates for the bill, which makes it a stop on the path rather than the start of one: influence reaches the bill through the people connected to the committee and to James Park.
Stage 3: read every edge in both directions
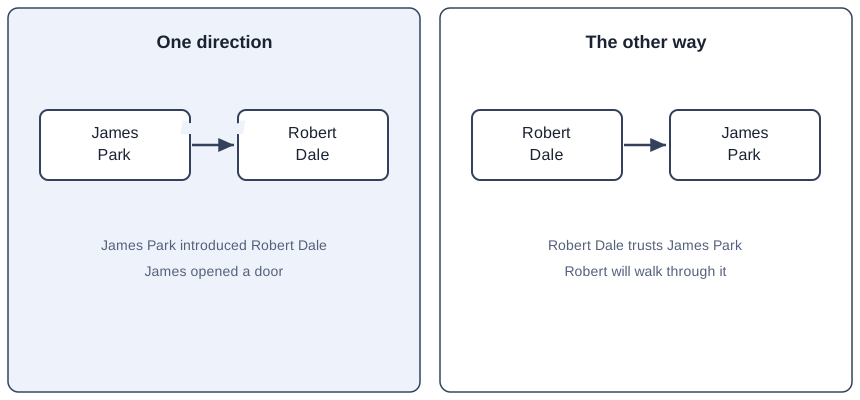
- Read every edge in both directions. Arrows have directions, and influence does not always follow them. James Park introduced Robert Dale, but the trust runs the other way: Robert Dale trusts James Park. The first edge tells you James opened a door; both together tell you Robert will walk through it. Check each line twice, once per direction, and keep the labels different where the truth is different. The W3C’s OWL 2 vocabulary names both patterns: some properties are symmetric, running the same way in both directions (like “co-chairs with”), and some are asymmetric (like “mentors”). Borrowing those two words keeps your labels honest about which way each edge points.
- Find the path the org chart hides. Now compare: pull up your real org chart and find one connection the hierarchy cannot show. Org charts manage accountability; relationship maps show how work moves. If your map and your org chart tell the same story, you mapped titles instead of relationships, and step 2 needs another pass.
Check your result: one map, one path, one surprise
You should see a map where every dot is a named person, company, committee, or event, and every line carries a defensible label. You should see one complete path from a person you can reach to a decision you want moved, with each handoff named, and at least one connection your org chart hides. Rename any line labeled “knows” or “works with”: vague labels are how the map goes stale.
Three mistakes that make your relationship map lie to you
Mapping job titles instead of relationships is the first mistake. “Reports to” and “manages” are the org chart wearing a different costume. If every edge in your map matches the hierarchy, you rebuilt the hierarchy and learned nothing. Keep the reporting lines that genuinely carry influence, and let the rest be introductions, trust, and mentorship.
Reading influence in one direction only is the second mistake. A line between two people is not a one-way street. James Park introduced Robert Dale, and Robert Dale trusts James Park, and each direction carries its own label. Assuming the arrow runs both ways is how you ask the wrong person for the introduction.
Recording gossip instead of connections is the third mistake. An edge belongs on the map only if it is verifiable: they served on the committee together, or she introduced him at the conference. If you would not say it in front of both people, do not draw it. A relationship graph is a working document, not a rumor file.
Get the starter kit
The starter kit holds the Riverbend sample as a CSV you can paste straight into the builder, plus twelve named relationship types with one-line definitions to start your own labels from. It is free with your email: the form on the demo page posts to our subscribe endpoint and reveals the download.
Go deeper: the Association Ontology book
The full treatment of relationship graphs, including how they pair with knowledge graphs to answer questions neither can answer alone, is a chapter in the Association Ontology book. Start with the Association Ontology article for the concept-level foundation.