Article
BeginnerAssociation Ontology
Your answers live in the connections between your systems. Graph science models those as nodes and edges, giving AI models the context flat search cannot.
Knowledge Graphs AI Context Data Strategy
A member calls with a question your membership director cannot answer from any one screen. Which sponsors have actually met your newest member companies? The sponsor list lives in the CRM, event attendance lives in the events platform, and the new members live in this year’s join report. The answer is in the connections between those systems, and no search box searches connections. Microsoft Research ran into the same wall with AI search: standard retrieval fails on questions aimed at a whole collection, like what the main themes are, because that is a summarization task rather than a lookup. Their answer was GraphRAG, which first builds a knowledge graph of entities from the documents, then lets the model work from the graph. For broad sensemaking questions over large collections, the GraphRAG paper reports substantial improvements over conventional retrieval in both the comprehensiveness and the diversity of answers.
Dots and lines
A graph, in this sense, is a simple thing. Dots and lines. The dots are nodes: the things. Your members, your events, your sponsors, your sessions, your topics. The lines are edges, also called relationships: what connects one dot to another. Maria attended the spring conference. The spring conference was sponsored by a member company. Neo4j’s own introduction to the idea defines it the same way: nodes are entities like people and places, and each relationship is the verb between two entities. Both can carry details. The member node holds the join date. The edge holds the year she attended, or the dollar amount of the sponsorship.
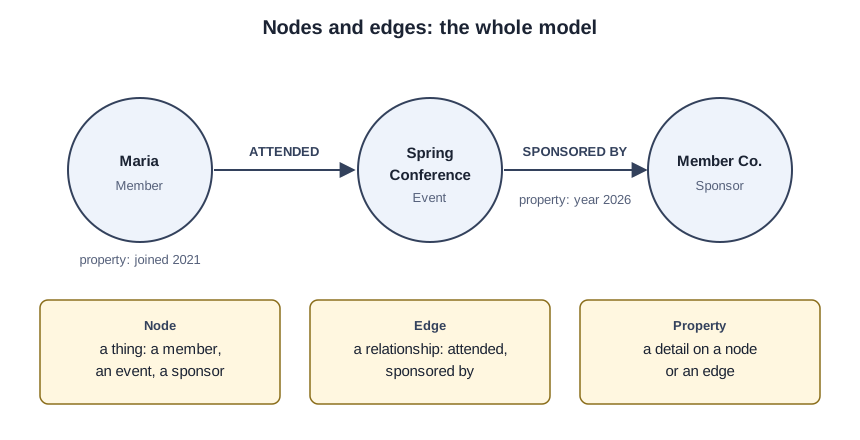
Nothing about this is new. Your staff already thinks this way. Ask a membership director who should sponsor next year’s gala and she will name companies by walking her mental graph: who exhibited, who knows whom, who gave last year. The graph only writes down what she already knows, in a form a machine can walk too.
Two kinds of graph worth knowing
Two kinds matter for associations, and the difference is what goes in the dots. The first is the knowledge graph: facts about the world, connected. Session A covers workforce development. Speaker B has spoken on workforce development three times. Those two facts share a topic node, so the model can see the connection neither document states outright. The second is the relationship graph of your own house: members, companies, chapters, events, sponsors, and every edge between them. Neo4j’s documentation treats both as property graphs, which means nodes and relationships with properties attached, a shape that fits messy real-world data better than a rigid table.
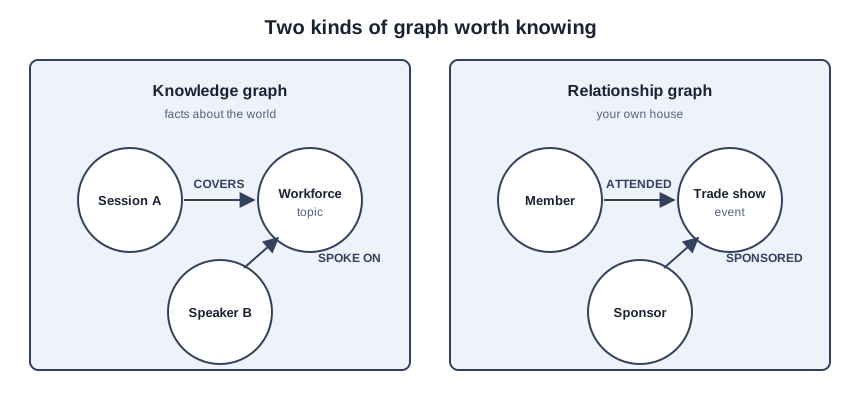
The knowledge graph answers what is true. The relationship graph answers who connects to whom. An association usually needs the second one first, because its hardest questions are about its own people.
What a graph gives the model
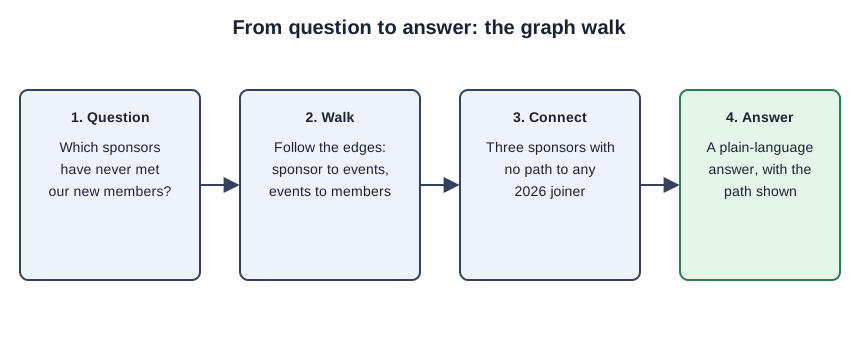
Flat AI search finds documents that resemble your question. It cannot walk. A graph lets the model walk: start at the sponsor node, follow the sponsored edges to events, follow the attended edges to members, and arrive at the members with no path to that sponsor. Connections the documents never state outright become answerable once the graph exists, which is the whole of the Microsoft researchers’ point. Our tutorial on running Laya triage on your own machine covers the retrieval half of this idea; the graph is the other half.
This is also why sponsors should care, from their side of the table. Sponsors are not really buying impressions. They are buying introductions: which members they can meet, which chapters overlap with their customers. A graph that shows which members a sponsor has never met is a sponsorship product, and the association that can draw it has something to sell that a banner never was.
The intelligence graph behind Refraction
This is the idea behind the intelligence graph inside Refraction. Trihelix, the sponsor of this site, built Refraction for Associations on nodes and edges: its graph tracks more than 14,000 individual associations and nonprofits, and an association can layer its own data onto that graph to connect the dots between what it knows about its members and what the wider sector looks like. You do not need our sponsor’s product to understand the shape. You need the shape to judge any product that claims to do this, including ours.
One association’s graph
This is a teaching example, not a case study. The fictional Bluegrass Equine Association has four hundred member farms, one spring trade show, and a dozen sponsors. Its membership director asks the graph a single question: which sponsors have never shared an event with our 2026 joiners? The graph walks each sponsor’s sponsored edges to events, then each event’s attended edges to members, and returns the sponsors with no path to any 2026 joiner. Example output: three sponsors, each listed beside the events they did attend, so the director can see the gap at a glance. Her next email writes itself, and it is introductions, not cold calls.
Seeing the dots
Once the shape is clear, the uses follow. A short list, each one a question your staff already asks:
- Which sponsors and members have never met, for the development desk.
- Which topics connect this year’s sessions, for program planning.
- Which member companies share chapters, for the membership team.
- Who knows whom before the big ask, for the board.
Drawn on a screen, a graph is dots and lines you can zoom and drag, and the eye finds clusters a spreadsheet hides. The fastest way to see one is Neo4j’s open example graphs on GitHub, which include a movies dataset and a business dataset built for exactly this kind of looking around.
The open-source fit, honestly
Graph databases sound expensive, and the enterprise versions are. But Neo4j’s licensing page says its Community Edition is fully open source under GPLv3 and free to use, including for an application your association runs itself. That is a genuine fit for a trade association budget: the software costs nothing. The honest caveat is the rest of the sentence. It is a database, and databases need someone technical to install, feed, and keep running. Most associations will meet graph technology inside a platform rather than by running one. Knowing the shape still matters, because it tells you what to ask the platform. When a vendor demos AI search, ask whether it walks relationships or only matches similar text. You now know the difference, and you know which one answers the member’s real question.
Three moves, none of which require buying anything. First, write down the three questions your staff gets asked that no single system can answer; those are your first edges. Second, keep the graph idea next to your data rules, because connections are only as trustworthy as the systems they come from. Third, remember the shape the next time someone sells you answers: dots, lines, and the walk between them.
Sources (4)
- Edge et al.: From Local to Global: A Graph RAG Approach to Query-Focused Summarization (Microsoft Research, arXiv:2404.16130, 2024)
- Neo4j GraphAcademy: Introduction to graph databases (nodes, relationships, property graphs)
- Neo4j licensing: Community Edition under GPLv3
- Neo4j graph examples on GitHub (open example datasets)