Tutorial
AdvancedCount Foot Traffic at Your Event With WiFi Sensing
Turn cheap WiFi boards into doorway counters and booth sensors: in/out counts with direction, dwell time, and a zone flow graph of your whole event floor.
Time needed: About 25 minutes
Before you start:
- Someone technical to flash firmware onto the boards (Route 1 below skips this)
- Roughly $500 in parts for a two-door, one-room pilot kit
- Venue access the day before the event for calibration
Wifi Sensing Foot Traffic Events Exhibitors Sponsorship
By the end of this tutorial you will be able to turn ordinary WiFi radio waves into a foot-traffic system for an event: doorway counters that tell entries from exits, booth sensors that measure how long people stay, and a zone-by-zone flow graph of the whole floor. You will also learn its limits.
Two routes. Route 1 is the strategy: read the placement, calibration, and monetization sections, then hand the kit spec to IT or a contractor. Route 2 is the full build: flash the firmware, run the aggregator, calibrate at the venue.
Try it now: the WiFi foot-traffic lab simulates the whole system in your browser: doorway links, a booth zone, dwell times, and the zone flow graph. A browser cannot read real WiFi radio data, so the signals are simulated; the processing (threshold crossings, trigger pairing, zone boundaries) is the real thing.
Seven moves, in order:
- See what the radio sees.
- Build the doorway counter.
- Cover a booth; solve close-but-outside.
- Chain the floor into a mesh.
- Add Bluetooth; stay honest about phones.
- Turn the counts into money.
- Calibrate; check against a human.
Step 1: see what the radio sees
Every WiFi transmitter fills a room with radio waves, and every body disturbs them. Channel State Information (CSI) is the receiver’s per-subcarrier measurement of that disturbance. A walking body makes a loud signature; a still body is quieter but not silent. Researchers at UC Santa Barbara used breathing and small movements to count seated crowds to within one person of the true count 96.3% of the time, and IEEE’s 802.11bf task group is standardizing WLAN sensing as a formal WiFi capability. The central honesty of this tutorial: the radio sees that someone is there. It never sees who.
Step 2: build the doorway counter
The doorway is the most reliable thing WiFi sensing does: one radio link gives crossings, two give direction.
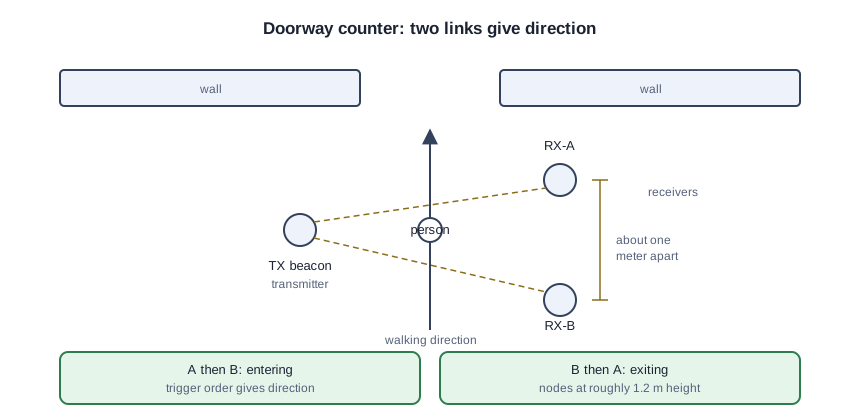
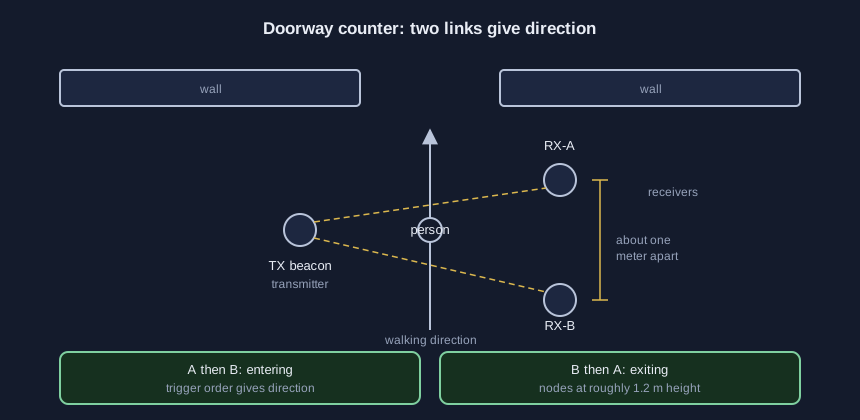
Per door: one transmitter on one side of the frame, two receivers on the other, about one meter apart along the walking direction, at roughly 1.2 meters height. Receiver A fires, then B: entering. B then A: exiting.
In published doorway tests, a WiFi counter identified the number of people passing through at 100% for one person, 81% for two, and 95% for three. The failure mode is bunching: two people crossing shoulder to shoulder make one rising edge and count as one. Stanchions that encourage single file are a placement decision, not an afterthought.
Step 3: cover a booth, and solve the close-but-outside problem
A booth is a zone with a boundary, and the boundary is what you sense. Do not measure distance from the router: indoor signal strength converts to distance with several meters of error, so a radial circle constantly misclassifies the person at the next booth.
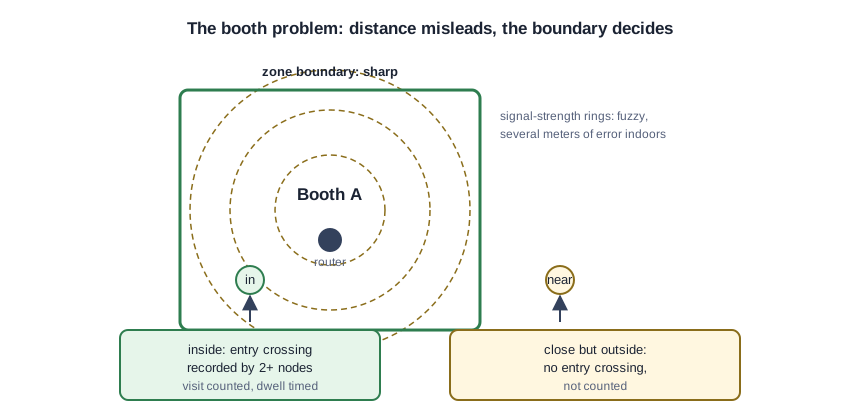
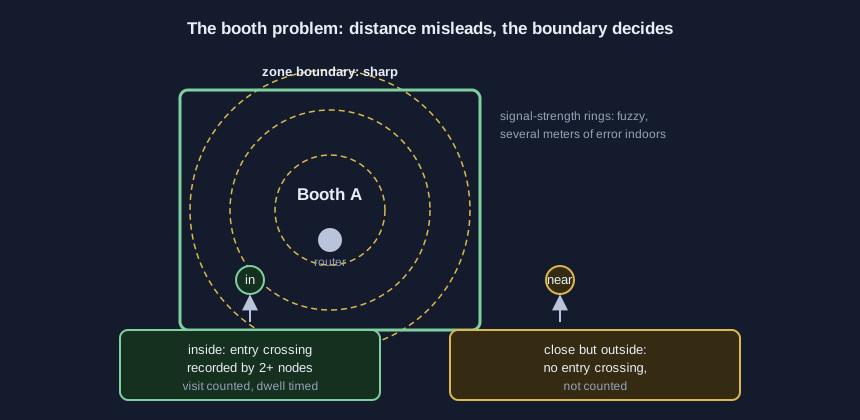
Put two or three receivers around the booth and look for the crossing signature at the booth’s edge, confirmed by more than one node voting. The person standing close but outside never produces the entry crossing, so the ambiguity disappears.
Dwell time falls out for free: entry timestamp minus exit timestamp, per visit. Report the median per booth, not the mean.
Step 4: chain the floor into a mesh
One beacon illuminates; many receivers listen. Per zone: one transmitter, two to four receivers, all streaming to one aggregator. Zones tile the floor; where two share a boundary, one’s exit crossing is the other’s entry.
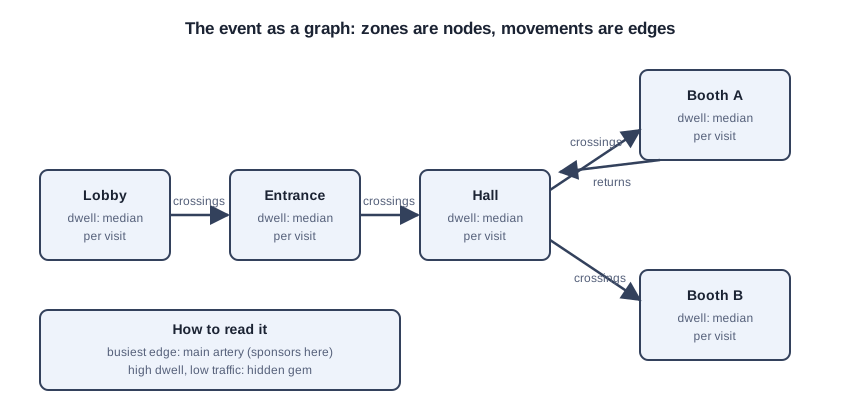
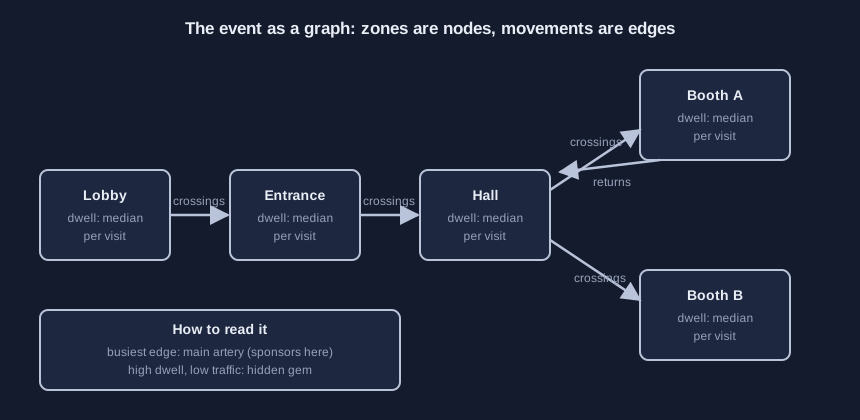
Now the network science: zones are nodes, movements are edges weighted by transition counts, dwell time weights the nodes. That is a relationship graph of your event, the same structure our Association Ontology article teaches for member data. The demo draws it live: the busiest edge is your main artery; the high-dwell, low-traffic node is the hidden gem; the zone nobody enters is a layout failure.
Step 5: add Bluetooth, and be honest about phones
Bluetooth helps, but only the half you deploy: beacons at entrances and booths broadcast stable IDs for zone presence. Attendee phones are the other half, and both iOS and Android randomize the MAC address a phone shows while probing, which kills passive per-device identity. The demo’s Bluetooth toggle shows this live.
The legitimate path to identity is opt-in: the event app, with permission granted, ties a stable app ID to a badge. Passive radio fingerprinting is an arms race, not a product; the honest unit here is the flow, not the person.
Step 6: turn the counts into money
For the association: the post-event traffic report. Each booth’s visits and median dwell become a sponsor product for next year’s booth sales; real traffic data prices premium positions.
For the exhibitor: dwell-qualified visits beat badge scans. A scan says someone walked past; a long dwell says a conversation happened. The live dashboard shows which booths are slammed and which sit empty, so floor managers move staff instead of guessing.
Step 7: calibrate the day before, then check against a human
Radio is environmental: thresholds set in your office are fiction at the venue. Budget two hours the day before. Record 30 seconds of empty-room baseline per node. Walk each door labeled (one, two, three people; both directions; spaced and bunched) to set direction thresholds and measure bunching undercount. Lock the thresholds; do not recalibrate on event day unless furniture moves.
Disclose it on the registration page: “This event uses anonymous, camera-free radio sensing to count attendance per zone. No images are captured and no personal devices are tracked.”
Event day: one door, one volunteer, one clicker, thirty minutes. If the two counts agree within about ten percent, trust the system; if not, the thresholds are wrong for this room. Print the bunching undercount in the report’s methodology note.
The Riverbend expo, specified
This is a teaching example, not a case study. The Riverbend Trade Association’s annual expo, one entrance, two booth rows:
- Main entrance: TX beacon on the left frame at 1.2 m; RX-A one meter inside; RX-B two meters inside. A-then-B is entering.
- Booth A (corner): three receivers; entry needs two of three to agree.
- Traffic report template: one row per door (entries, exits, net, bunching undercount), one row per booth (visits, median dwell, longest dwell).
Five mistakes that make the count lie to you
Bunching undercounts at rush (the demo’s rush toggle shows it). Metal near a node skews the baseline; keep nodes clear of truss and warmers. Recalibrating after furniture moved voids the locked config. Signal strength as a tape measure lies indoors. Per-person identity from passive phones: step 5 ended that idea.
Take the starter kit
The starter kit holds the aggregator sketch (Python: UDP listener, trigger pairing, CSV log), firmware pointers for the ESP32 boards, the placement guide, the calibration checklist, and the disclosure template. Free with your email through the form on the demo page.
Sources (4)
- UC Santa Barbara: 'Don't Fidget! WiFi Will Count You' (Mostofi lab, seated crowd counting)
- Sensors: 'A People-Counting and Speed-Estimation System Using Wi-Fi Signals' (2021, 21(10), 3472)
- IEEE 802.11 Task Group BF (WLAN Sensing) project page
- 'Probing for Passwords: Privacy Implications of SSIDs in Probe Requests' (arXiv, MAC randomization survey)