Tutorial
IntermediateBuild a Custom GA4 Dashboard That Answers Five Questions
Build a one-page dashboard with free tools that answers the five questions your team actually asks about the website: where visitors come from, what they read, and which pages turn them into members, registrants, and subscribers.
Time needed: About two hours the first time, most of it waiting on data to populate
Before you start:
- Admin access to your association's GA4 property
- A free Looker Studio account (same Google login works)
- One colleague who knows which pages matter: the join page, the event registration page, the newsletter signup
Ga4 Analytics Dashboard Looker Studio Marketing
By the end of this tutorial you will have a one-page dashboard, built entirely with free tools, that answers five questions your team actually asks about the website: where visitors come from, what members read, and which pages turn visitors into members, registrants, and subscribers.
Most association teams already collect web data and still cannot answer those questions. Back in 2012, NTEN’s State of Nonprofit Data, covered by ASAE’s Associations Now, found that 99 percent of nonprofits tracked metrics somewhere, but communications and marketing data were tracked less consistently than financials, and many merely measured instead of using data strategically. The tooling got a major upgrade since; the habit mostly did not. This tutorial builds the habit: one page, five questions, numbers you will actually open.
Step 1: Write your five questions before you open any tool
Dashboards fail when they start with charts. Start with the questions your team asks in meetings, in plain words. For most associations, five cover nearly everything:
- Where do new visitors come from?
- Which pages do members actually read?
- Which pages lead to membership joins?
- Which pages lead to event registrations?
- Which pages lead to newsletter signups?
Write yours down and get your colleague to agree they are the right five; everything below exists to answer exactly these. AOTA, the occupational therapy association, did this well: a 2017 Associations Now piece describes how its team joined Google Analytics with CMS and membership data to see the paths members took through the site, then used on-site search data to overturn a content policy hiding articles members wanted. The dashboard served the questions; the questions came first.
Step 2: Fix data retention before you build anything
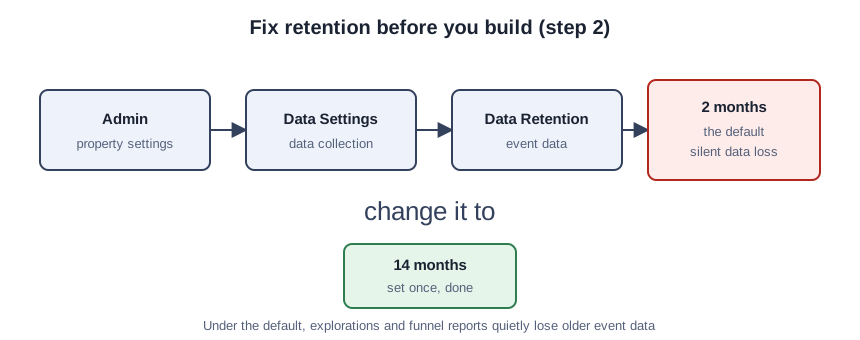
This is the step everyone skips and the one that silently ruins dashboards months later. In your GA4 property, go to Admin, then Data Settings, then Data Retention, and change event data retention from 2 months to 14 months. The default is 2 months, which means your explorations and funnel reports quietly lose older data while the standard reports look fine. Set it to 14 months now; it cannot recover what already aged out.
Step 3: Mark your three key events
A dashboard answers “which pages lead to joins” only if GA4 knows what a join is. In Admin, under Events, mark these as key events: the membership join confirmation, the event registration confirmation, and the newsletter signup confirmation. Name them in plain words your successor will understand: membership_join, event_registration, newsletter_signup, not conv_1. If GA4’s event model is new to you, TechSoup’s nonprofit GA4 walkthrough covers events, conversions, and account structure in nonprofit terms.
Step 4: Tag the links you send out
“Where do new visitors come from” is unanswerable if every link looks identical. Tag the links in your emails, social posts, and partner mentions with UTM parameters: utm_source (newsletter, linkedin), utm_medium (email, social), utm_campaign (spring_membership_drive). Keep a one-line log of campaign names so next quarter’s staff uses the same spellings. Ten minutes here is the difference between “traffic went up” and knowing which email brought the joins.
Step 5: Build the one-page report in Looker Studio
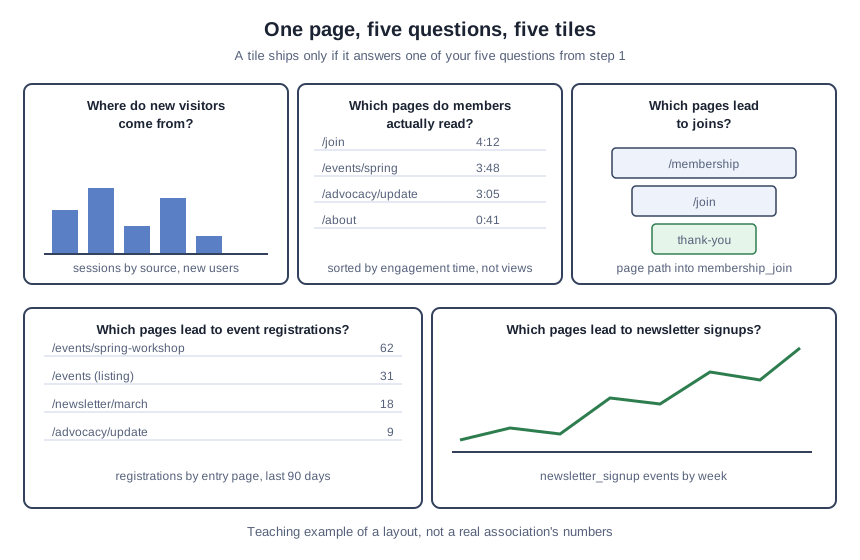
Looker Studio is free with a native GA4 connector: create a blank report, add GA4 as a data source, and build one page with five tiles, each answering one question from step 1:
- Where do new visitors come from? A bar chart of sessions by session source and medium, filtered to new users.
- Which pages do members actually read? A table of page path with views and average engagement time, sorted by engagement time. Views tell you what got clicked; engagement time tells you what got read.
- Which pages lead to joins? A funnel or a simple table: page path leading into the
membership_joinkey event. - Which pages lead to registrations? The same, for
event_registration. - Which pages lead to signups? A time series of
newsletter_signupevents by week, so you can see which sends moved the line.
Resist tile six. Every dashboard grows barnacles; the discipline of this tutorial is that a tile must answer one of the five questions or it does not ship.
Step 6: Share it and schedule delivery
A dashboard nobody opens is a hobby. Share the Looker Studio report with your team, and schedule a monthly email delivery to yourself and your colleague from step 1: the report arrives, you spend ten minutes asking whether each tile moved and why. Put a quarterly thirty-minute review on the calendar now, while you are thinking about it.
Step 7: Run the two-minute check
Ask each of your five questions and point at the tile that answers it. Two failure modes to fix on the spot:
- A tile shows “(not set)”. GA4 is missing dimension information, usually because a custom dimension was never registered. In Admin, under Custom Definitions, register it (event-scoped), wait a day, and check again.
- A funnel is empty. The key event from step 3 is not firing. Open the page, complete the action yourself, and watch GA4’s real-time view to confirm the event arrives.
The dashboard that measures everything and answers nothing
Three mistakes we see in nearly every first dashboard, so you can skip them:
Building before writing the questions. The tool makes it easy to add tiles. Tiles without questions become decoration within a month. If a tile does not answer one of your five, delete it.
Skipping step 2. The retention default is the cruelest setting in GA4: everything looks fine until the quarter you need last year’s funnel and it is gone. Fourteen months, once, today.
Reporting views instead of reading. A page with ten thousand views and eleven seconds of average engagement time is a page people bounced from, not a page people read. Sort by engagement time when the question is what members read.
One more, for the revenue side of the house: sponsors and exhibitors increasingly ask for proof their investment reached the right audience. A dashboard that joins web behavior with membership and event data answers exactly that: which segments engaged with which content, and what brought them there. The AOTA example above joined analytics to membership data for content decisions; the same join, pointed at sponsor questions, turns this dashboard into renewal-season evidence. Build it for your team first; the sponsor story follows.
Sources
- NTEN’s State of Nonprofit Data, via ASAE Associations Now (2012): 99 percent of nonprofits tracked metrics; communications and marketing data tracked less consistently than financials.
- Associations Now: Analytics Will Make You See Members Clearly (2017): AOTA’s dashboard joining GA, CMS, and membership data; search-term data overturning a content policy.
- TechSoup Global: The Nonprofit Guide to Google Analytics (2023): nonprofit GA4 walkthrough covering events, conversions, and account structure.